Chapter 19: Graphics
One of the exciting and interesting features of a Pebble smartwatch is the screen. The high-resolution capabilities of the display together with a rich set of graphics APIs give us many ways to render images, draw objects, and display text. This chapter will explore the basics of graphics functionality of the Pebble smatwatch platform.
As with the last chapter, this chapter is by no means meant to be the definitive guide to graphics on a Pebble smartwatch. Rather, the purpose here is to describe the basic concepts of graphics on a Pebble smartwatch and to provide some examples in C that will allow you to practice drawing and rendering on the Pebble smartwatch display. We will finish by providing references for you to read further and some exercises for you to practice your graphics strength.
Basic Graphics Concepts
There are some basic concepts that we should discuss before diving into the Pebble smartwatch graphics APIs. These concepts come from general graphics ideas and apply to more than just Pebble smartwatches. We will focus on the concepts that apply to Pebble APIs.
Pixels and Objects
At its core, a display is a set of pixels, arranged in a two-dimensional matrix. A pixel is a point in a display or image; it has size and color. It represents the smallest element of a display or image that can be individually manipulated.
The size of pixels matters to the display or image. Larger pixels make images look "pixelated" or "jaggy"; smaller pixels make images look more detailed or sharper. The size of pixels is usually characterized by a measure of an image or display: pixels per inch (or PPI) is a measure used to resolution of an image. More pixels per inch means more detail and higher resolution.
Pixels have color. A pixel is a sample of an original image and has a single color to represent the area it sampled. In computer systems, a color is typically represented by three component intensities: red, green, and blue. We have reviewed color values on Pebble smartwatch displays in Chapter 12; on a Pebble smartwatch display, a pixel can have up to 64 different colors: 4 values from each of red, green, or blue for a total of 6 bits per pixel.
Images are typically discussed in terms of pixels, but when we discuss graphics and drawing primitives, we can group pixels into shapes or text. Shapes are a basic object of graphics drawing capabilities: shapes like rectangles, circles, and elipses. Shapes have common properties; for example, shapes can be drawn as an outline or filled and with solid colors or grandients. Text is drawn from a set of predesigned shapes called a font. Object drawing functions are usually phrased in terms of shapes; text drawing functions usually include a specification of font.
Graphics Context
There are many properties that govern the way a shape or text is drawn. Lines have color and width; shape fill has color. The properties that will affect how an object is drawn are grouped together into something called a graphics context.
There are several properties included in a graphics context.
- current fill and line colors
- line widths
- drawing and clipping box
- compositing mode
- antialiasing
We should discuss the last three properties.
The drawing and clipping boxes are the bounds of the graphics areas on a display. Drawing boxes outline the entire area used to draw; clipping boxes are a (usually) temporary constraint on the area to draw. Without specifically setting clipping boxes, drawing graphics will be done in the constraints of the drawing box.
For example, let's say that a drawing box starts at coordinate (60,60) on a smartwatch screen and is 100 pixels wide with a height of 100 pixels. If we draw a line from (10,10) to (30, 10) in the drawing box, the line will actually be drawn from (70,70) to (100,70) on the screen. Now, we add a clipping box at (20,10) that is 20 pixels wide and 20 pixels high, the line will appear in the clipping box only. The drawing will have been clipped by the box to only 10 pixels long.
Compositing mode controls how the graphics are rendered on the screen. Sometimes compositing can be thought of as an operation of blending. For example, if an image's pixels were copied to from the image directly to the screen without change, the compositing mode is called "assignment". If the image's pixels were inverted before being copied, the compositing mode used is called "inverted assignment". In both of these cases, there is no blending of of the image pixels with the pixels already on the screen.
There are six compositing modes available for rendering images:
- Assignment (GCompOpAssign): Pixel values are copied directly from the source image to the destination. Because pixels are not changed or blended with any other pixels, this mode is available on all Pebble smartwatch platforms.
- Inverted Assignment (GCompOpAssignInverted): Pixel values are inverted and then copied from source image to destination. Because pixel inversion only really makes sense for 1 bit displays, this mode is only supported on non-color displays.
- OR Assignment(GCompOpOr): Pixel values are or'd (bitwise) with the destination pixel value, with the result copied to the designation. This is supported only on non-color displays.
- AND Assignment(GCompOpOr): Pixel values are and'd (bitwise) with the destination pixel value, with the result copied to the designation. Because a bitwise operation really make sense only with 1-bit displays, this is supported only on non-color displays.
- Clear (GCompOpClear): Using the source image as a mask, the destination image is cleared (pixels have a 0 value, or black color). If the bit in the source is 1, the destination bit is cleared at that coordinate. Again, because this only makes sense for 1-bit displays, this mode is supported only on non-color displays.
- Set (GCompOpSet): Using the source image as a mask, the bits in the destination are set. This mode is used to apply transparency to images.
Antialiasing is a technique used to smooth images. Because pixels are square, images can look like they are composed of squares, which would make lines and borders have "jaggy" edges. Antialiasing reduces these jaggy edges by surrounding them with shades of color. The jaggy edges become visually less prominent. However, the image also becomes blurrier and less focused. Thus, antialiasing is a balanced technique.
We group these properties together in a graphics context so that we don't have to specify each one every time something is drawn on the screen. We usually include a specification of the context when we call a drawing function, but we don't itemize each property. When we want to change a property, we change it in the context that is specified with drawing functions.
There is usually a default context for a specific drawing instance. Therefore, there is rarely any need to create a context and specify every single property. Contexts are send to all callbacks that need to do drawing and those functions can change contexts as they need to.
As an example, let's consider the "concentric circles" project we looked at in the last chapter's Project Exercises. We can draw concentric circles using a loop and a graphics context like this:
static void draw_circles(GContext *ctx) {
  GColor color = GColorBlack;
  graphics_context_set_stroke_color(ctx, GColorBlack);
  for(int radius = screen_width / 2; radius >= 0; radius -= 10) {
    color.argb += 5;
    graphics_context_set_fill_color(ctx, color);
    graphics_fill_circle(ctx, center, radius);
    graphics_draw_circle(ctx, center, radius);
  }
}
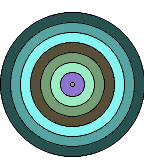
In this example, we set the "stroke color", that is, the line color, to be GColorBlack using graphics_context_set_stroke_color(). Whenever we draw a line, or use a "draw" graphics function call, until we change the stroke color, lines will be black. In the loop, we set the "fill color", that is, the color that fills shapes when we use "fill" graphics calls, to the variable color, which increments through the possible colors. We use the function graphics_context_set_fill_color() to do this. Note that each time we change the context, we include the context variable ctx. The example includes two calls to draw circles using this ctx context and the circles are drawn using the properties we set.
The example produces a display like that in Figure 19.1:
Now, let's add a call to turn off antialiasing. The circles are not drawn like those in Figure 19.2:
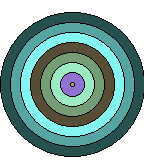
The lines in Figure 19.3 are noticeably smoother than those in Figure 19.4.
Vectors and Bitmaps
We have seen that drawing or rendering to a Pebble smartwatch screen can be done using many different techniques. However, there are really only two methods for representing and storing objects on a Pebble smartwatch: using bitmaps or vector graphics.
Bitmaps are used for pictures and graphics that can be stored as a set of pixels with a numeric value per pixel. Each pixel in a bitmap image is stored as a combination of red, green, and blue colors along with a representation of transparency. We have discussed this for a Pebble smartwatch display as a range of 64 different colors: 4 values from each of red, green, or blue or 8 bits per pixel with transparency. A big advantage to bitmap images is that we can manipulate them algorithmically; we can analyze and possibly alter an image because we can examine each point of color that makes up the image.
Vector graphics take a different approach to images. This approach uses geometric primitives such as lines and curves. In this case, a picture file is made up of a series of instructions describing the primitives making up the image and their locations. One advantage of vector images is that they can be scaled both up and down to be displayed at any resolution. Storing images as vector images usually results in smaller files than their bitmap counterparts, since a line, for example, requires storage of only 2 points, rather than the color values of each individual pixel.
Bitmap Compression
Bitmaps can be large files, especially for high-resolution data. For example, at 8 bits per pixel, a 12MP camera generates 12 MB of data. We can use bitmap compression formats to reduce this size. The same camera data in Portable Network Graphics (PNG) format is just under 7 MB. A JPG format of this data is around 2.5 MB.
There are many bitmap compression formats and algorithms. One of the differences between them is the amount of data lost in compression. PNG is a lossless format: pixels are compressed as much as possible without losing any data. JPG is a lossy format: its compression algorithm loses some data (rationalized as hardly detectable when decompressed) in exchange for greater compression rates.
The Pebble SDK supports the use of PNG bitmap files.
Both bitmaps and vector graphics are embraced by Pebble SDKs. Bitmaps are richly supported using "gbitmap_" functions; see Pebble docmentation on graphics types. There are drawing functions as well as analysis and construction functions.
Vector graphics are supported through "gdraw_" functions; see Pebble documentation on draw commands. Many of these general vector functions are made specific in the use of drawing paths, common shape drawing functions (circles, rectangles, and lines), and text drawing.
The Basics of Drawing
Drawing Common Objects
Drawing common graphics objects is made easier in the Pebble SDK by functions that are focused on them. These common objects are:
- pixels
- lines
- rectangles
- circles
- arcs
- bitmaps
Each of these objects have their own drawing functions. In the case of rectangles and circles, there are both outline drawing functions and filled drawing functions. For rectangles, there is a function that will draw a rectangle with rounded corners.
As an example, consider the draw_circles() function from the last section. That example drew concentric circles using the graphics_fill_circle() function, which draws a outline around the circle specified, and the graphics_draw_circle() function, which draws a filled circle.
Similar functions are defined for the other "shaped" objects.
In the case of bitmaps, You can only draw a bitmap in a defined rectangle area. This clips the bitmap if it is outside the bounds of the rectangle specified. You can also rotate a bitmap before drawing. Rotation uses antialiasing.
Drawing Bitmaps
A bitmap is a collection of pixels that make up an image. The display on a Pebble smartwatch is also made up of pixels. A bitmap is the closest thing to working directly with a display. The Pebble SDK has many tools for working with bitmaps.
First, we need to define what format a bitmap could have. A bitmap could be composed of single-bit values that represent colors: 0 for white and 1 for black. A bitmap could also be a color bitmap, using 8-bit values. We have discussed several times how 6 bits represent mixes of red, green, and blue. The remaining 2 bits defines levels of transparency: zero for opaque and all ones for completely transparent.
A bitmap is a large area in memory, so we really could just allocate and use a set of bytes to contain pixel value for a bitmap. But there are many ways to work with a bitmap, so using the Pebble SDK functions is much more convenient. In addition, a GBitmap is a struct with more information in it than just an array of pixel data.
Creation of a bitmap can be done in a number of ways. Creating a blank, zero-filled bitmap can be done through the gbitmap_create_blank() function, whose prototype is below:
GBitmap * gbitmap_create_blank(GSize size, GBitmapFormat format);
Here we need the number of pixels and format of those pixel specified. This is the simplest way to create a bitmap, but there are other ways to create one, including functions that use predefined data. Here is a list:
- create a blank bitmap with a color palette (
gbitmap_create_blank_with_palette()) - create a bitmap from data in a resource file (
gbitmap_create_with_resource()) - create a bitmap from raw PNG format data (read from a file or created)(
gbitmap_create_from_png_data()) - create a bitmap from part of another bitmap (
gbitmap_create_as_sub_bitmap())
Once created, blank bitmaps need to be filled with data. This is done using the gbitmap_set_data() function, the prototype for which is below:
void gbitmap_set_data(GBitmap * bitmap, uint8_t * data, GBitmapFormat format, uint16_t row_size_bytes,
                      bool free_on_destroy);
This function needs the bitmap to fill (bitmap), the data to fill it with (data), the format to use (format), the number of bytes per row (row_size_bytes), and a determination of whether to free the data when the bitmap is destroyed (free_on_destroy).
When a bitmap is created and has data, it will likely need to be drawn on the display. Bitmaps must be drawn in a rectangle area. The graphics_draw_bitmap_in_rect() function does this; the prototype is below:
void graphics_draw_bitmap_in_rect(GContext * ctx, const GBitmap * bitmap, GRect rect);
The graphics context is needed (ctx), as usual, along with the bitmap to draw (bitmap) and the rectangle to draw it in (rect).
When an app is done with a bitmap, it needs to be destroyed to free up resources. The gbitmap_destroy() function does this:
void gbitmap_destroy(GBitmap * bitmap);
Let's take an example. In chapter 5, we gave a Project Exercise 5.2, where you were to replace the colors in an image. The declarations in the program declares two bitmaps and sets up the width and height of the the screen and the bitmaps:
GBitmap *old_image, *image;
uint8_t *bitmap_data;
int bytes_per_row;

// Set the correct screen height and width (checking for Pebble Time Round)
int HEIGHT = PBL_IF_RECT_ELSE(168,180);
int WIDTH = PBL_IF_RECT_ELSE(144,180);

// Set the height and width of the image
int IMAGE_HEIGHT = 76;
int IMAGE_WIDTH = 56;
Note that the bitmap data is a set of 8-bit bytes; we use the system type uint8_t for this data.
Now, we create the bitmaps using this code:
image = gbitmap_create_with_resource(RESOURCE_ID_IMAGE);
old_image = gbitmap_create_with_resource(RESOURCE_ID_IMAGE);
The RESOURCE_ID_IMAGE is a file that is included in the application install package (we discuss resource files in Chapter 17). Both bitmaps are created with the same data from the same file.
We are going to display both bitmaps, but change the colors in one of them. To do this, we also need some data derived from the bitmaps. We need the actual byte data, so we can look at each pixel, and the number of bytes per row:
bitmap_data = gbitmap_get_data(image);
bytes_per_row = gbitmap_get_bytes_per_row(image);
In the project code, we examine each bitmap pixel and change one color to another. After we replace the colors in the bitmaps, we draw the bitmaps to the screen:
void draw(Layer *layer, GContext *ctx){
    graphics_context_set_compositing_mode(ctx, GCompOpSet);
    graphics_draw_bitmap_in_rect(ctx, old_image, GRect((WIDTH-IMAGE_WIDTH)/2, 4, IMAGE_WIDTH, IMAGE_HEIGHT));
    graphics_draw_bitmap_in_rect(ctx, image, GRect((WIDTH-IMAGE_WIDTH)/2, HEIGHT-4-IMAGE_HEIGHT, IMAGE_WIDTH, IMAGE_HEIGHT));
    graphics_context_set_stroke_color(ctx, GColorBlack);
    graphics_draw_line(ctx, GPoint(0,HEIGHT/2), GPoint(WIDTH,HEIGHT/2));
}
In this code, we set the compositing mode in the graphics context to "set" (only the pixels where the bits are non-zero are set). Next, we draw each image in a rectangles that is both IMAGE_WIDTH wide and IMAGE_HEIGHT high. However, each starts at a different location: 4 pixels from the top for the old image and 4 pixels from the center for the new image. Both images are centered horizontally. We end this code by drawing a black line through the vertical center.
Drawing Text
We can draw many things on a Pebble smartwatch screen; we also draw text. For a smartwatch screen, drawing text is the only way we display text. Since we are able to draw text, we can use graphics contexts to manipulate text attributes.
Text renderings have several attributes that can be manipulated.
- Font is the most obvious attribute. Fonts govern the style of the characters in the text.
- Alignment is an attribute that dictates placement within a box or space.
- Color specifies the color of characters in a font.
- Overflow mode specifies how to handle text that does not fit into a box or space.
Often, text is specified as being drawn in a box or space. Like a clipping box, this text box defines boundaries that text will be rendered into. Alignment and overflow are defined with respect to this box; the box can clip text that is too big to be completely rendered into it.
Let's consider an example. Let's put some text over the circles from the previous section. Here's the code:
static void draw_circles(GContext *ctx) {
  GColor color = GColorBlack;
  graphics_context_set_stroke_color(ctx, GColorBlack);
  for(int radius = screen_width / 2; radius >= 0; radius -= 10) {
      color.argb += 5;
      graphics_context_set_fill_color(ctx, color);
      graphics_fill_circle(ctx, center, radius);
      graphics_draw_circle(ctx, center, radius);
  }
  graphics_context_set_text_color(ctx, GColorRed);
  graphics_draw_text(ctx,
            "Getting Dizzy",
            fonts_get_system_font(FONT_KEY_GOTHIC_24_BOLD),
            GRect(0,80,144,100),
            GTextOverflowModeTrailingEllipsis, GTextAlignmentCenter, NULL);
}
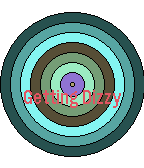
Notice the text color is set in the graphics context. The call to draw text include the context, the text to be drawn, and specifications of the attributes listed above: font, alignment, and overflow mode. The text box is given as a box 144 by 100 pixels, starting at point (0, 80). This renders the image in Figure 19.3.
Now let's adjust some of these attributes.
static void draw_circles(GContext *ctx) {
  GColor color = GColorBlack;
  graphics_context_set_stroke_color(ctx, GColorBlack);
  for(int radius = screen_width / 2; radius >= 0; radius -= 10) {
      color.argb += 5;
      graphics_context_set_fill_color(ctx, color);
      graphics_fill_circle(ctx, center, radius);
      graphics_draw_circle(ctx, center, radius);
  }
  graphics_context_set_stroke_width(ctx, 4);
  graphics_context_set_text_color(ctx, GColorBlue);
  graphics_draw_text(ctx,
            "Getting Dizzy",
            fonts_get_system_font(FONT_KEY_GOTHIC_24_BOLD),
            GRect(0,80,75,30),
            GTextOverflowModeTrailingEllipsis, GTextAlignmentCenter, NULL);
}
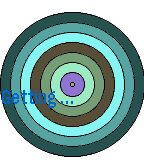
Here, we change the stroke width and the text box size. The result is shown in Figure 19.4. In this example, the stroke width means nothing with respect to text. However, the box size is too small and therefore the overflow mode means something. The text is truncated and ellipses are added.
More experiments with text can be found below in the Project Exercises.
Drawing Paths
The Pebble SDKs have drawing functions that draw circles and rectangles; drawing other shapes requires that we use a drawing path. A drawing path is a set of points that can be moved or rotated.
Let's take an example. Let's say we want to draw an animal. We don't have an image to render, but if we work with some graph paper and a steady hand, we can get a set of points that might draw one. From a set of 43 points, here is a chameleon:
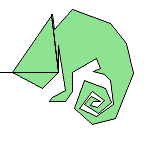
To specify this drawing, we need a set of points that could make up a path. The type GPathInfo is a struct with two elements: num_points giving the number of points and points giving the actual points. To draw our lizard, we could specify this:
static const GPathInfo lizard_points = {
  .num_points = 43,
  .points = (GPoint []) {
      // head
      {0,72}, {58,72}, {42,88}, {12,72}, {52,14}, {54,29}, {72,9},
      // body
      {110,23}, {126,43}, {133,73},
      // tail to tip
      {115,118}, {92,124}, {74,108}, {84,80}, {105,88}, {111,102},
      {98,113}, {84, 104}, {91,96}, {100,101},
      // tip to foot
      {93,101}, {90,105}, {97,107}, {104,100},
      {92,91}, {79,108}, {96,116}, {113,104}, {110,80},
      // foot
      {104,74}, {93,71}, {100,68}, {96,58},
      // other foot
      {72,72}, {72,91}, {65,101}, {49,101}, {52,97}, {65,90},
      // the rest
      {58,45}, {58,72}, {51,14}, {58, 72}
  }
};
We need a path, created from these points. The path must have a GPath type and is created with the gpath_create() function, like this:
GPath *lizard_path = gpath_create(&lizard_points);
Now we have a path, which we need to draw on the screen. We can draw the path filled with a color or we can just draw the outline. For our example, we do both.
graphics_context_set_fill_color(ctx, GColorGreen);
gpath_draw_filled(ctx, lizard_path);
graphics_context_set_stroke_color(ctx, GColorBlack);
gpath_draw_outline(ctx, lizard_path);
Notice we still use a graphics context to specify colors and other properties.
Now that we have gone through all the trouble of plotting points for a drawing, let's say we now need to move the drawing down 20 pixels and 10 pixels to the right. In addition, we need to rotate it 20 degrees. We could replot all the points, but we could use path movement and rotation functions, like this:
GPath *lizard_path = gpath_create(&lizard_points);

gpath_rotate_to(lizard_path, TRIG_MAX_ANGLE / 360 * 20);
gpath_move_to(lizard_path, GPoint(20, 10));

graphics_context_set_fill_color(ctx, GColorGreen);
gpath_draw_filled(ctx, lizard_path);
graphics_context_set_stroke_color(ctx, GColorBlack);
gpath_draw_outline(ctx, lizard_path);
And the final result looks like that in Figure 19.6.

We should make a final note about closed and open paths. A closed path is one that starts and ends at the same point. An open path is one that does not end at the point it started on. Only closed paths can be drawn filled. Open paths can be drawn with an outline. The gpath_draw_outline() function draws an through a closed path; the gpath_draw_outline_open() function draws an outline through an open path.
Drawing to the Framebuffer
In a way, everything we have discussed to this point has been slightly abstract: we have ignored the details of what it takes to actually draw to the screen. In a Pebble smartwatch, the framebuffer is the connection between the software of the smartwatch and the hardware of the screen. Drawing directly to the framebuffer has several advantages, but the higher level concepts of bitmaps, shapes, and pixels are not available.
In order to work directly with the framebuffer, we must "capture" and "release" it. Once the framebuffer is accessed in this way, it is made unavailable for higher-level drawing functions. To capture the framebuffer, we must use the graphics_capture_frame_buffer() function. It's prototype is here:
GBitmap * graphics_capture_frame_buffer(GContext *ctx);
When the framebuffer is captured, the framebuffer data is delivered in the form of a bitmap in memory, pointed to by the GBitmap pointer returned by the capture function. This bitmap may be manipulated by the functions that the Pebble SDK provides for bitmaps (see below for references). Any changes made to the bitmap are committed to the framebuffer when the framebuffer is released.
To release the framebuffer, you need the graphics_release_frame_buffer() function, whose prototype is:
void graphics_release_frame_buffer(GContext *ctx, GBitmap *fb);
Note you have to include the framebuffer bitmap when releasing the framebuffer. This applies the bitmap to the framebuffer directly.
The advantage of drawing bitmaps directly to the framebffer is speed. It is faster to render a bitmap to the framebuffer than it is to draw with other, higher-level functions. The big disadvantage is the loss of those higher-level abilities to work with graphics objects. For example, drawing paths cannot ge rendered to the framebuffer.
Pebble Documentation References
The point of this chapter is not to define graphics on a Pebble smartwatch but to discuss the basics, give examples, and to help you practice. There are documents that describe graphics in detail. The links below will help you build on the concepts we have discussed in this chapter.
- Basic graphics elements, with extensive functions on bitmaps, are available here.
- Graphics contexts are covered here.
- Basic drawing is covered here along with a brief dicussion of bitmaps.
- Very basic drawing functions, including a set of functions for designing animations, are available here.
- Text drawing is described here and fonts are discussed here.
- Drawing to the framebuffer is discussed here.
Project Exercises
Project 19.1
For this exercise, make your own starter code. We are going to immediately draw an animal without fielding any events. In order to draw an animal, go to the Web site at this link. There is a large collection of animals there. Each is drawn with basic shapes you can draw with the Pebble SDK.
Pick an animal and write the code to draw that animal on a Pebble smartwatch screen. Make sure you cite where you found the drawing of the animal.
These types of drawing sometimes are better done using graph paper. You can print free graph paper at many Web sites (for example, like this one).
An example answer is available here.
Project 19.2
For this project, we are going to work with the chameleon we gave in this chapter as an example. You can find the complete program that generates the chameleon here.
The chameleon still needs a few features. Change the code to draw the following items:
- There should be a bug at the end of its tongue. Draw a diamond there. Fill the diamond with black.
- The lizard needs an eye. Draw a filled circle where its eye should be. This needs to be small and filled with black. Draw another circle around the eye, only an outline, to give the eye an eye socket.
- The tongue needs to be longer. Use the
gpath_move_to()function to move the drawing to the right, then draw a line to extend the tongue. Make sure the bug stays at the end of the tongue. - The lizard needs a name. Put text under the drawing that gives announces the lizard's name.
An answer to this project can be found here.
Project 19.3
This project will make some changes to Project 5.2, discussed in this chapter. Start with that code.
Write code to replicate the little man on the display. Each time the "up" button is pressed, double the number of images on the display. Each time the "down" button is pressed, reduce the number by half. Remove the line drawn on the screen.
The images should be displayed evenly without overlapping. Do this by computation, not hardcoding. Eventually, you won't be able to add to the screen without overlapping; when that happens, do replicate further. Likewise when there is only one image on the display, ignore the "down" button.
An answer to this project can be found here.
Project 19.4
Get this project's starter code here. It contains 3 files: an image of a chameleon, a picture of water, and an image of a city street. The starter code reads in the files.
For this project you are to put the water or the street images behind the chameleon. To do this, examine each pixel of the chameleon image. When the pixel color is exactly blue, that is, the blue value is maximal blue with no red or green values, copy the pixel at the same location in either the water image or the street image to the new chameleon image. Organize this by button press: when the "up" button is pressed, put the chameleon in water; when the "down" button is pressed, put the chameleon on the street.
This the same method used by weather forcasters on television: the weather map is digitally placed on the TV screen by a computer while the forecaster is standing in from of a blue screen.
Much of the bitmap creation and destruction is in the starter code. You need to fill in the code for reload_images().